Which Countries Lead FDI Stock in Saudi Arabia, 2024?
Published 9 October 2026 · Last updated 12 October 2026
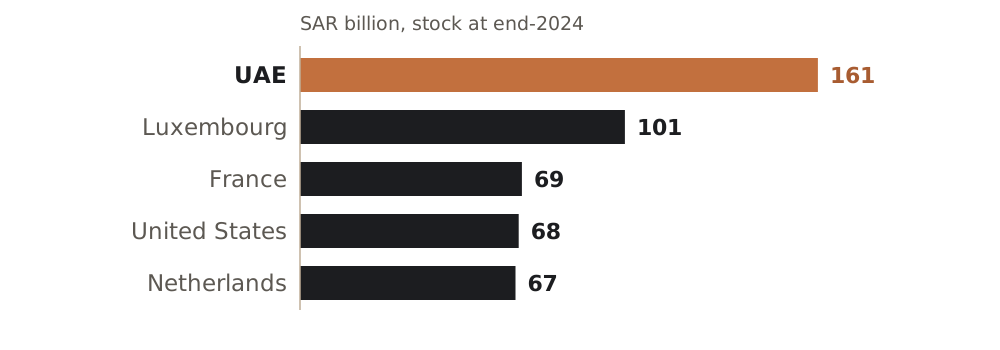
The five countries that Figure 3 of the General Authority for Statistics bulletin shows by foreign direct investment stock in Saudi Arabia at the end of 2024 are: the UAE with SAR 161 billion, then Luxembourg with SAR 101 billion, France with SAR 69 billion, the United States with SAR 68 billion and the Netherlands with SAR 67 billion. These five hold about 48% of the total stock of SAR 977 billion (Zeej calculation). This page sets out the figures, what can be said about them and what cannot.
Which five countries does Figure 3 show by stock?
By foreign direct investment stock at the end of 2024, in SAR billion:
- UAE: 161.
- Luxembourg: 101.
- France: 69.
- United States: 68.
- Netherlands: 67.
The five add up to SAR 466 billion of SAR 977 billion, about 47.7% (Zeej calculation based on the General Authority for Statistics). The whole foreign investment stock stood at SAR 977 billion, up 9% from the end of 2023. In its stock section the bulletin text names only the first three countries; the United States and the Netherlands figures come from the same figure, which shows five countries, not a full list.
Is the ranking by stock the same as the ranking by flows in the same year?
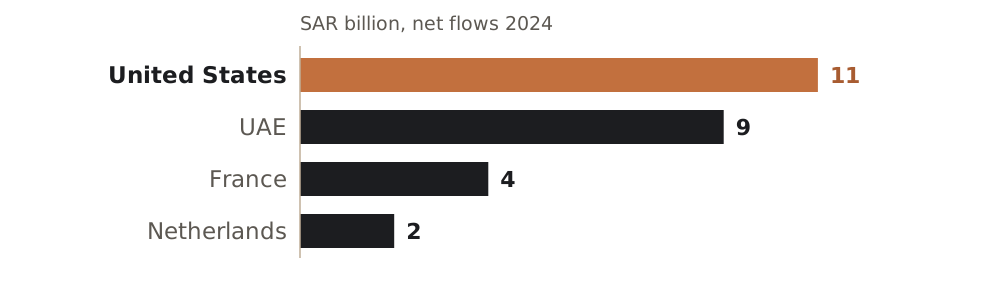
No. In 2024 net flows the United States came first with SAR 11 billion, then the UAE with SAR 9 billion, France with SAR 4 billion and the Netherlands with SAR 2 billion, while Luxembourg recorded a negative net flow of SAR 1 billion, according to the Authority. A stock is the accumulation of many years; a flow is a single year, and the country at the top of the stock is not necessarily the top country in the latest year.
Can we infer the nationality of capital owners from this distribution?
No. The bulletin does not say whether the classification is by country of the direct investor or by country of ultimate origin of the capital, and the difference matters: in our reading, a country may appear in the distribution because a holding entity there owns the stake, not because its citizens own the funds. We therefore do not conclude that citizens of Luxembourg or the Netherlands own those funds, and we read the distribution as one of the countries recorded in the statistics, not of investors' nationalities.
How should the change in the total between 2023 and 2024 be read?
Inflows rose from SAR 96 billion in 2023 to SAR 119 billion in 2024, up 24%. Outflows rose from SAR 10 billion to SAR 39 billion. Net flows therefore fell 6%, from SAR 86 billion to SAR 80 billion, according to the Authority. The Authority defines outflows as what reduces the liabilities side, such as dividends paid and loans repaid, and net flows as the difference between inflows and outflows, according to the methodology report of its quarterly bulletins.
What are the limits of these figures?
- The latest annual bulletin we reviewed covers 2024. We did not find an annual 2025 bulletin in the Authority's publications list as of 9 October 2026, so there is no 2025 breakdown by country.
- The Authority says the annual bulletin's indicators are based on register data from the Ministry of Investment.
- Amounts are rounded to the billion, and the differences among 69, 68 and 67 are within rounding, so their order should not be relied on.
- Total 2025 inflows are known: USD 32.6 billion according to UNCTAD, a figure that differs from the sum of the Authority's quarterly inflows for 2025 (about SAR 135.8 billion, or about USD 36.2 billion at the 3.75 peg, adding its bulletins), so the two sources should not be mixed and we do not explain the gap.
What does this mean for an investor or business owner?
This distribution shows the countries recorded in the statistics with the largest positions that Figure 3 displays, so a business owner can see which countries' entities they are likely to meet as partners, competitors or customers. It is not a recommendation to invest or to partner, and ranking from largest to smallest does not make the largest country the best-suited partner: the criterion is the partner's activity, size and capacity. The decision starts with the legal route and the minimum commitment before it starts with the identity of other investors, which is what our full study, "How to Invest in Saudi Arabia: New Law and Capital Flows", examines when it is published at the end of this month.
Zeej works with investors and business owners on this same decision, within our «Investment Opportunity Assessment» service.
Want to see where your business stands?
Start with our free diagnostic and get a first, structured reading of your business.
Start the Free Diagnostic